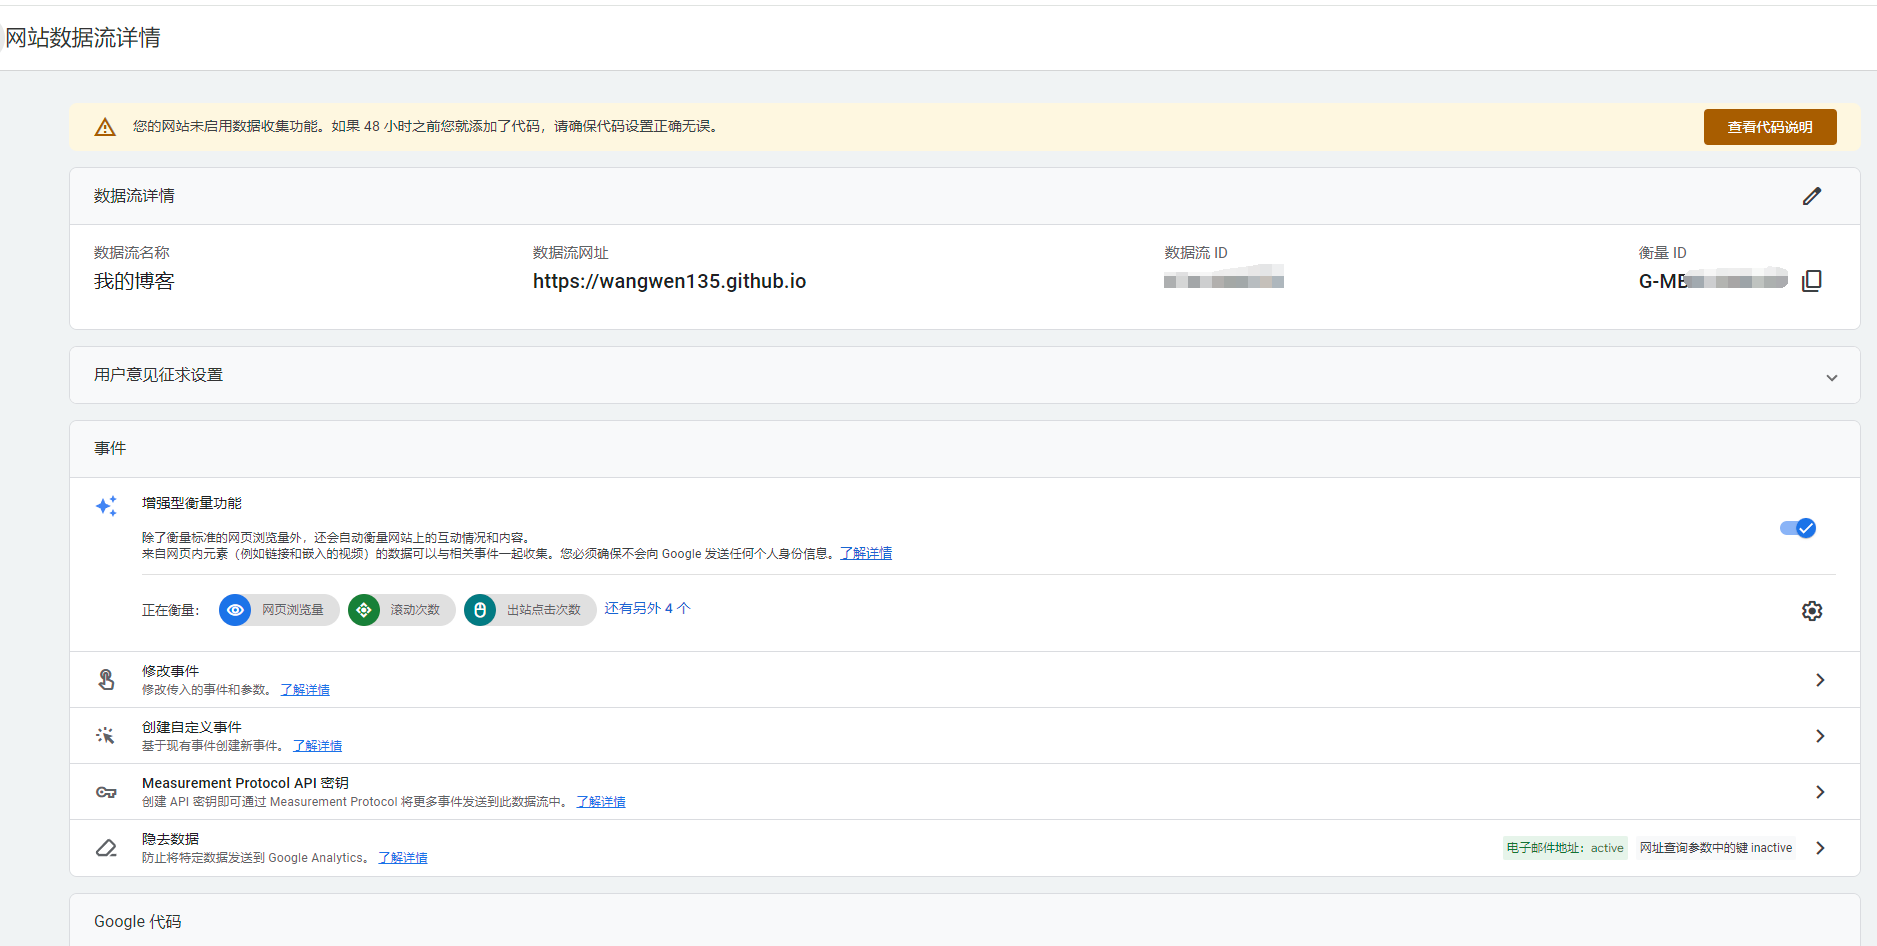
# Google Analytics
# See: https://analytics.google.com
google_analytics:
  tracking_id: G-XXXXXXXXXX   # 替换为你的 GA4 追踪 ID

  # By default, NexT will load an external gtag.js script on your site.
  # If you only need the pageview feature, set the following option to true to get a better performance.
  only_pageview: true   # 如果只需要页面浏览量追踪,可以设置为 true
替换为你的 GA4 追踪 ID
保存配置并重新生成网站
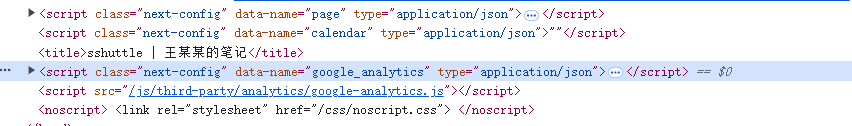
在源代码中应该能看到 Google Analytics 相关的内容:
测试验证
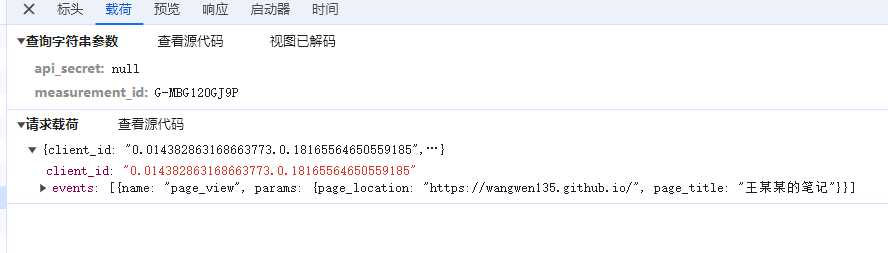
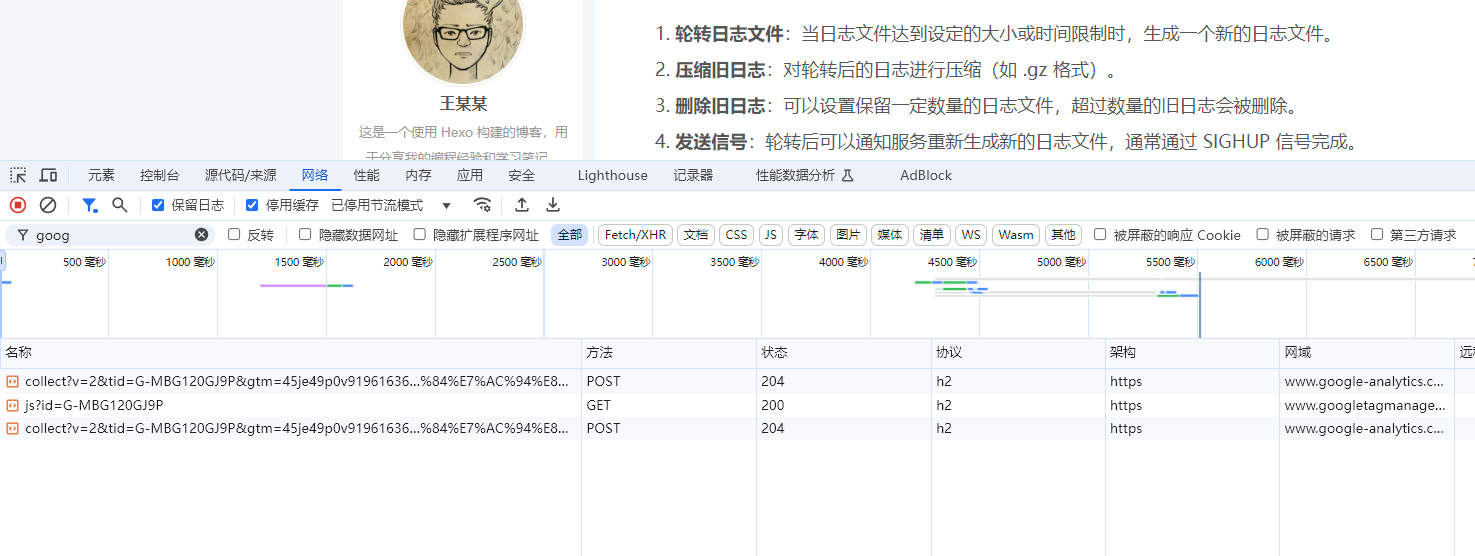
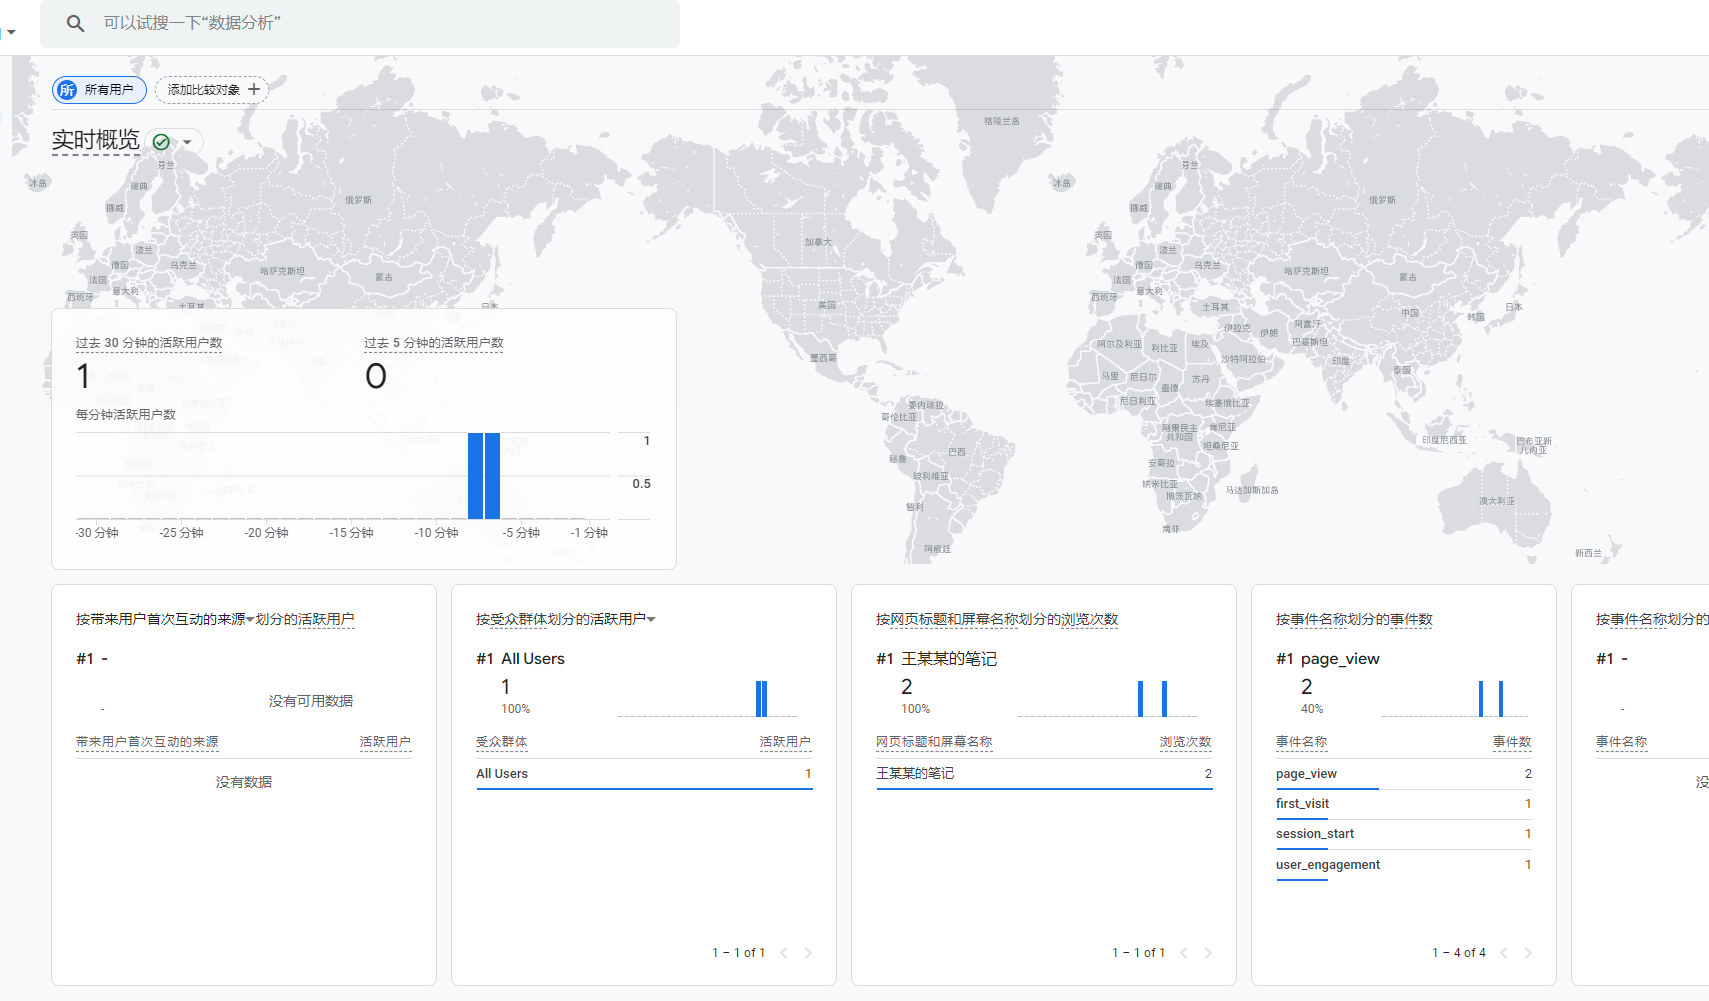
访问你的网站,并在 Google Analytics 后台的“实时(Real-time)”页面查看是否能看到访客信息。如果能看到你的访问记录,说明 Google Analytics 已成功集成。
<!-- Google tag (gtag.js) -->
<script async src="https://www.googletagmanager.com/gtag/js?id=G-MBG120GJ9P"></script>
<script>
  window.dataLayer = window.dataLayer || [];
  function gtag(){dataLayer.push(arguments);}
  gtag('js', new Date());

  gtag('config', 'G-MBG120GJ9P');
</script>
注意替换你自己的ID
然后取消NexT配置文件_config.next.yml 中 custom_file_path 下 head 的注释
1
2
3
4
5
6
# Define custom file paths.
# Create your custom files in site directory `source/_data` and uncomment needed files below.
custom_file_path:
  head: source/_data/head.njk
  #header: source/_data/header.njk
  #sidebar: source/_data/sidebar.njk
def add_front_matter(directory): for root, _, files in os.walk(directory): print(f"Scanning directory: {root}") for file in files: if file.endswith('.md'): file_path = os.path.join(root, file) print(f"Found markdown file: {file_path}")
try: with open(file_path, 'r', encoding='utf-8') as f: content = f.read() title = os.path.splitext(file)[0] date = get_random_date() tags = os.path.basename(root) categories = os.path.relpath(root, directory).split(os.sep)